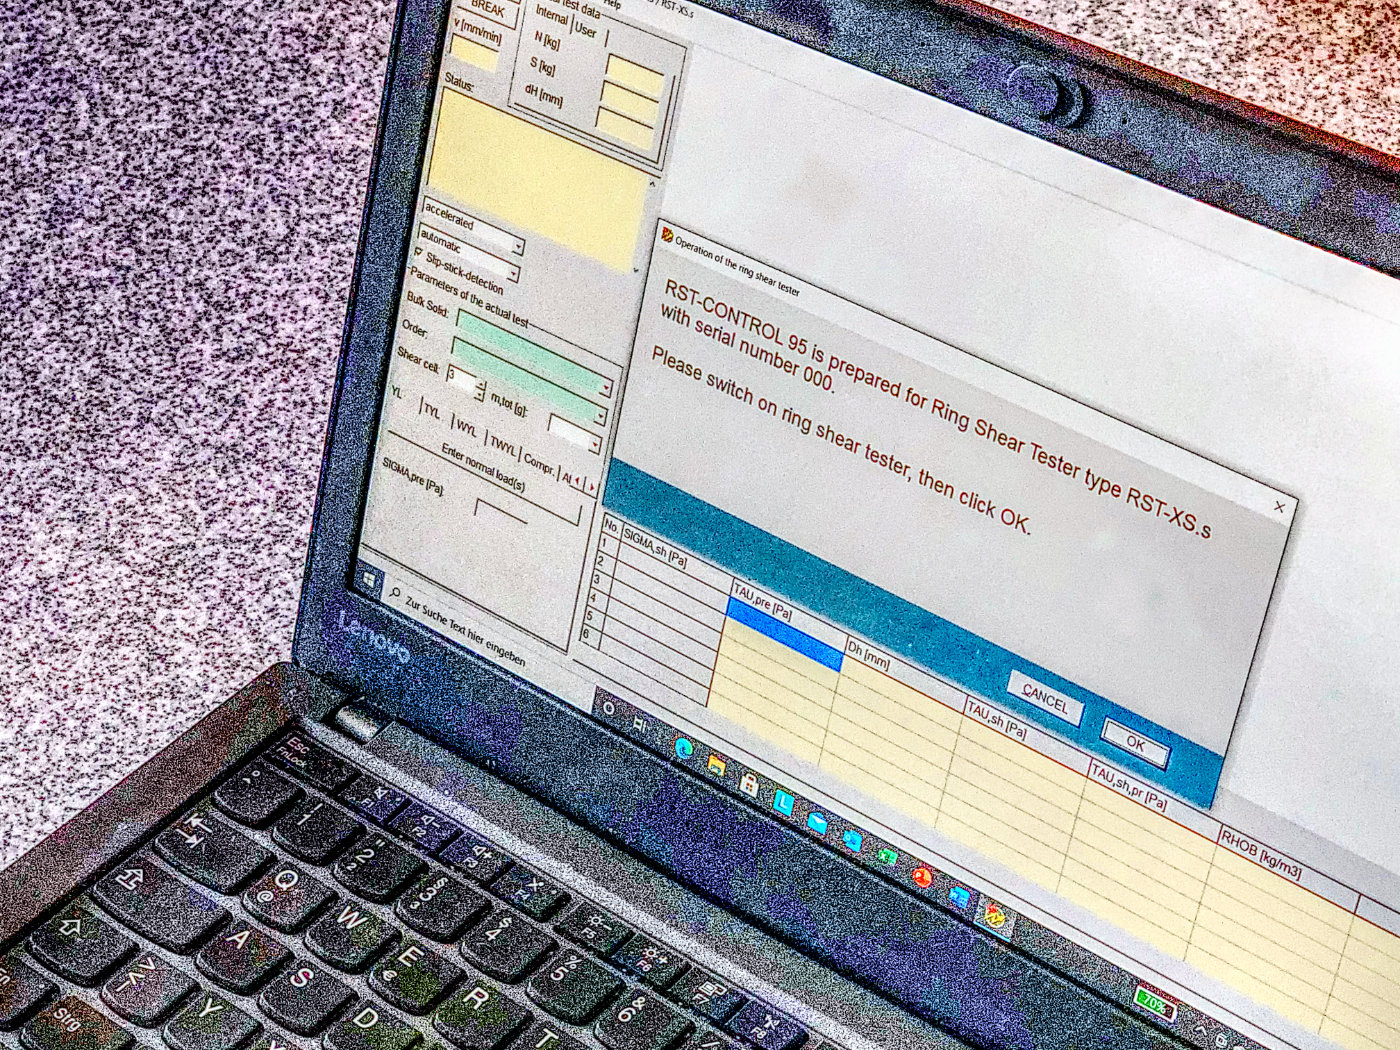
Example: Yield locus test with RST-CONTROL 95
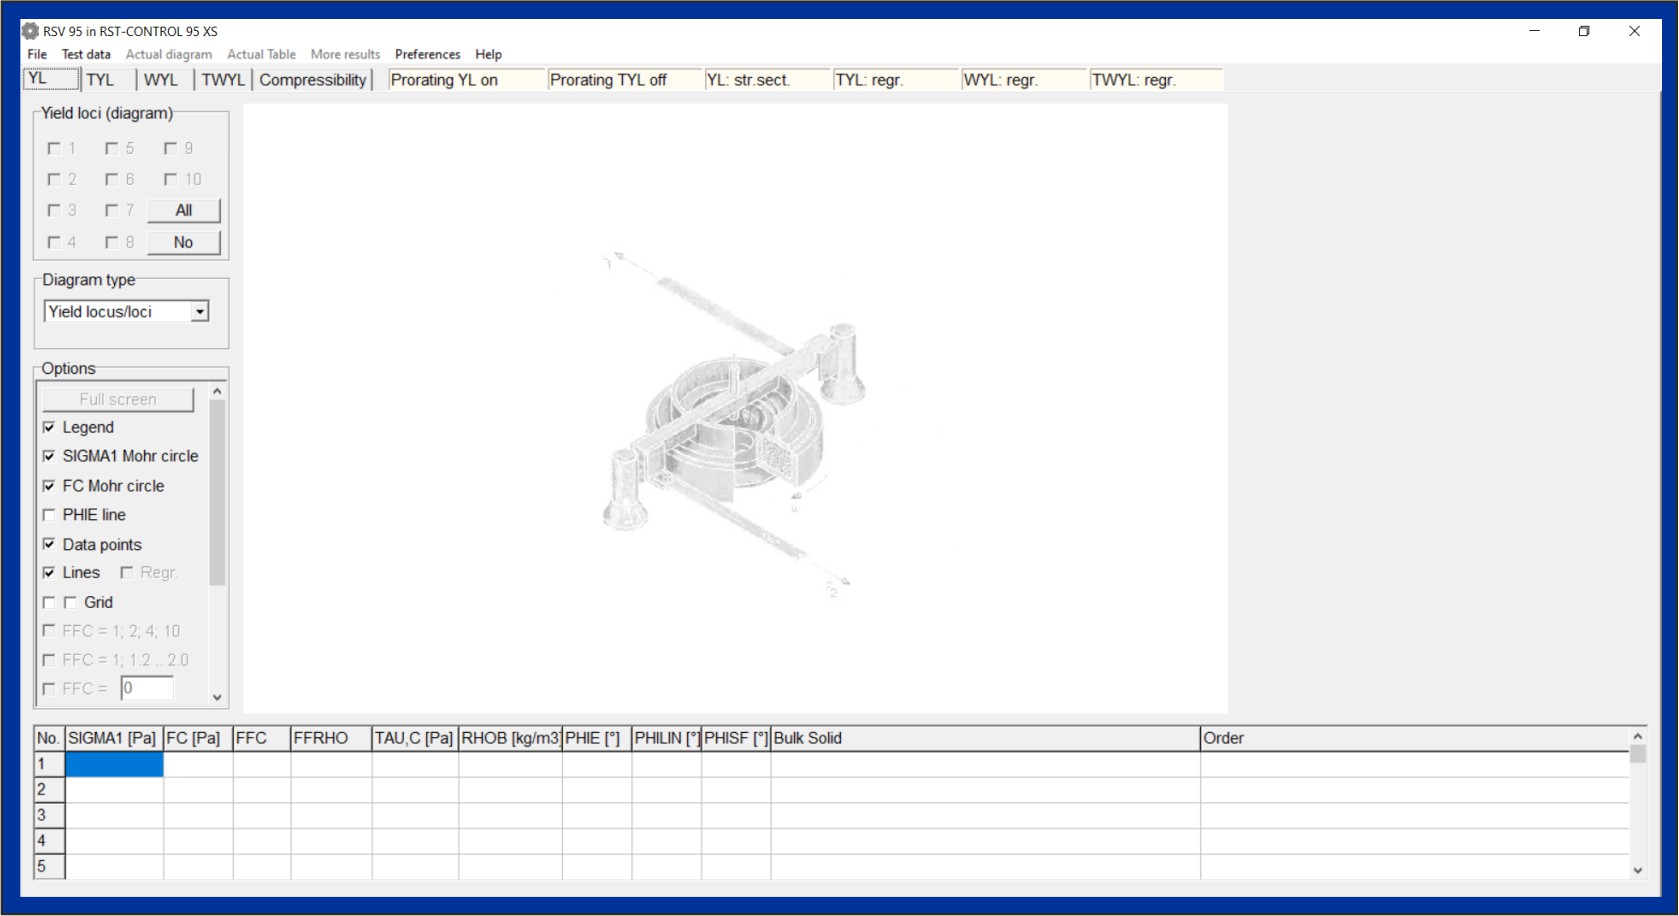
 After starting the program,
RST-CONTROL 95 shows the evaluation window (picture below). Here,
the different measurements (yield loci, wall friction tests, time
consolidation, ...) can be viewed, edited and exported as
graphics. If several yield loci of the same product were measured
at different stresses, graphs of bulk density, unconfined yield
strength, or internal friction versus consolidation stress can be
plotted in diagrams.
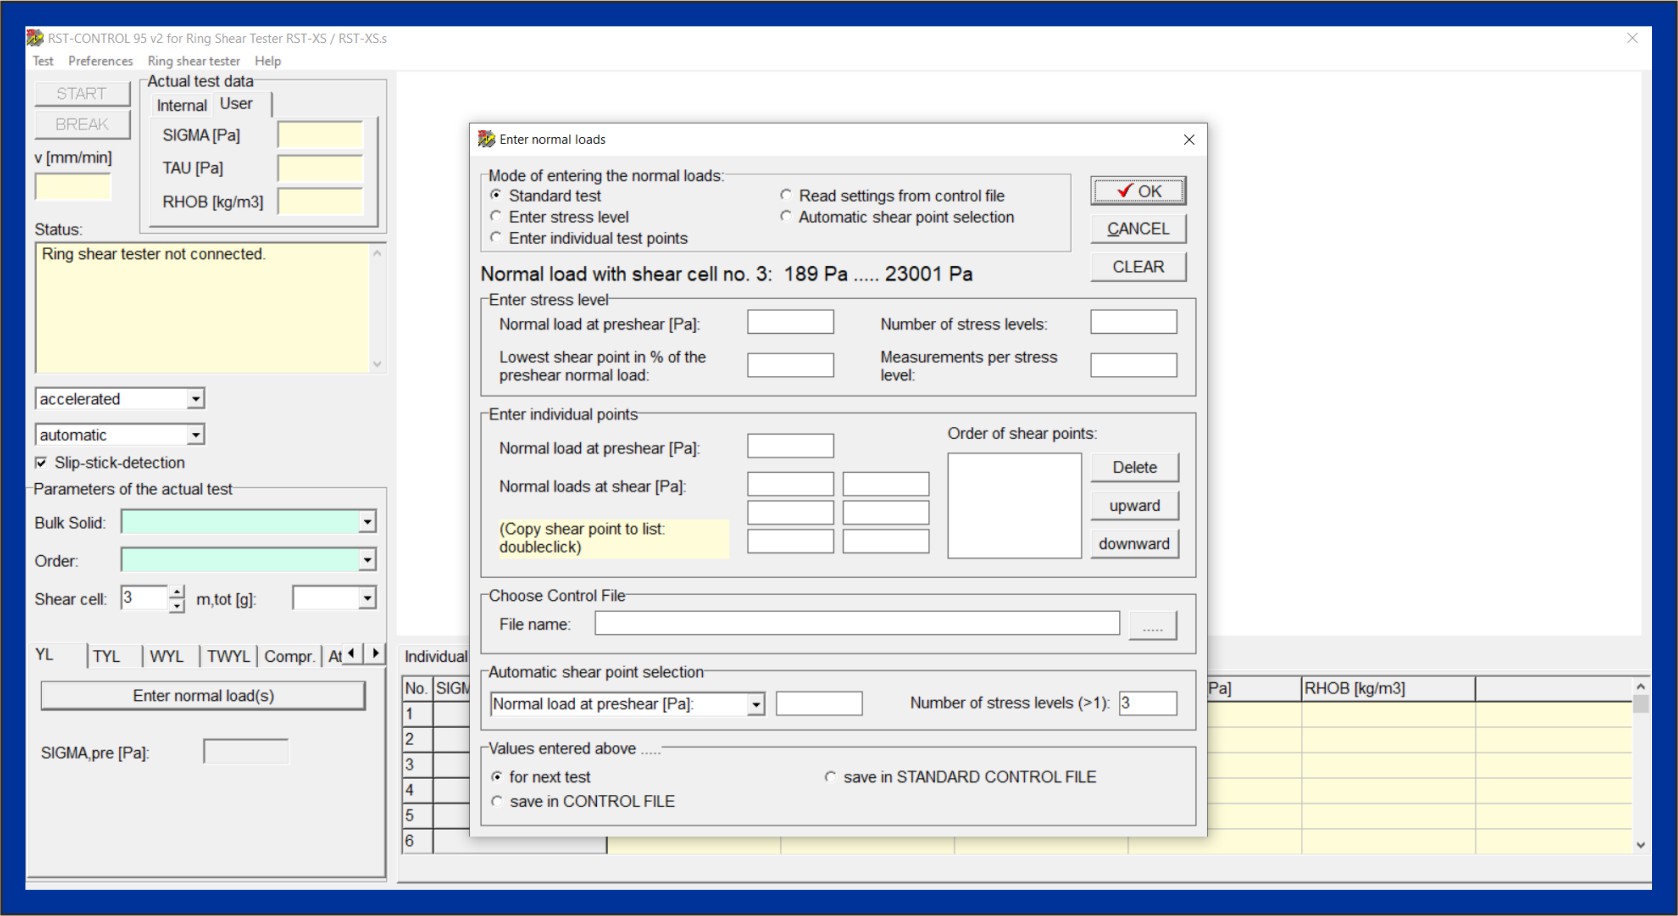
From the evaluation window you reach the measuring window
(RST-CONTROL 95 window, see figure below). In the lower left area
of the window, select the type of measurement, e.g. YL = yield
locus, or WYL = wall yield locus and select the number of the
shear cell that shall be used for the test. For entering the
normal stresses of the test points are entered in a window. On the
image the window for entering the normal stresses for a yield
locus test is opened. Depending on the requirements, a standard
test can be selected here, or previously created test procedures
(CONTROL files) can be opened, or individual test points can be
specified.
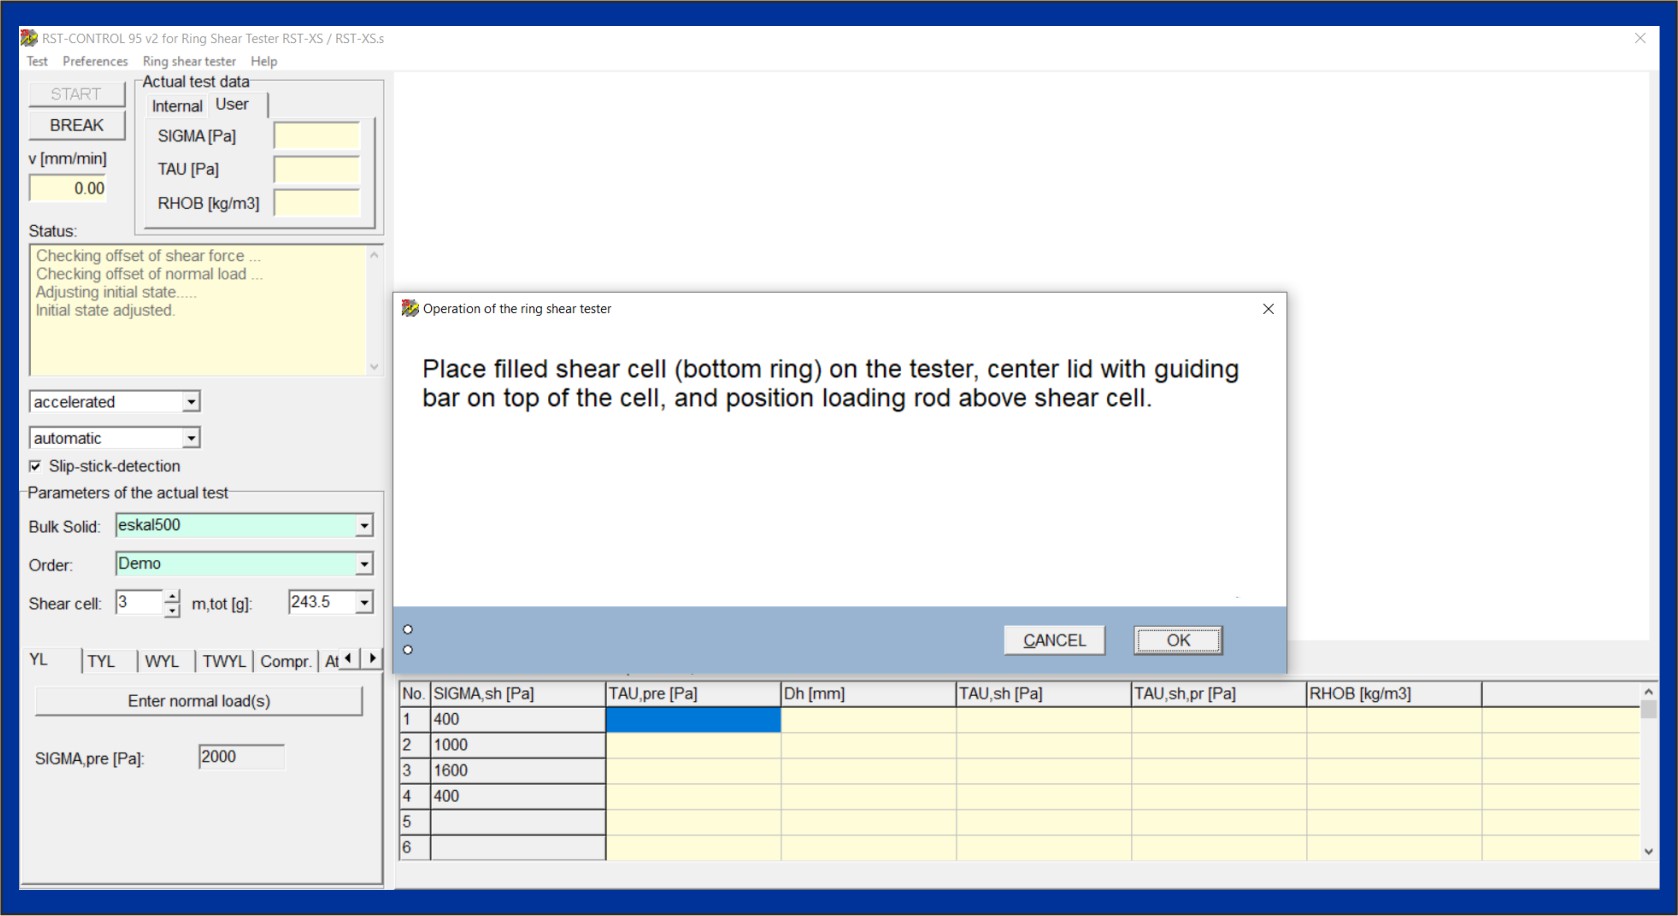
After the normal stresses, the name of the sample and the mass of
the filled shear cell have been entered, the test procedure is
started. As shown in the picture below, RST-CONTROL 95 guides you
through the procedure: Place the shear cell on the tester, etc.
This can also be done by voice output if the ring shear tester is
a little distant from the PC.
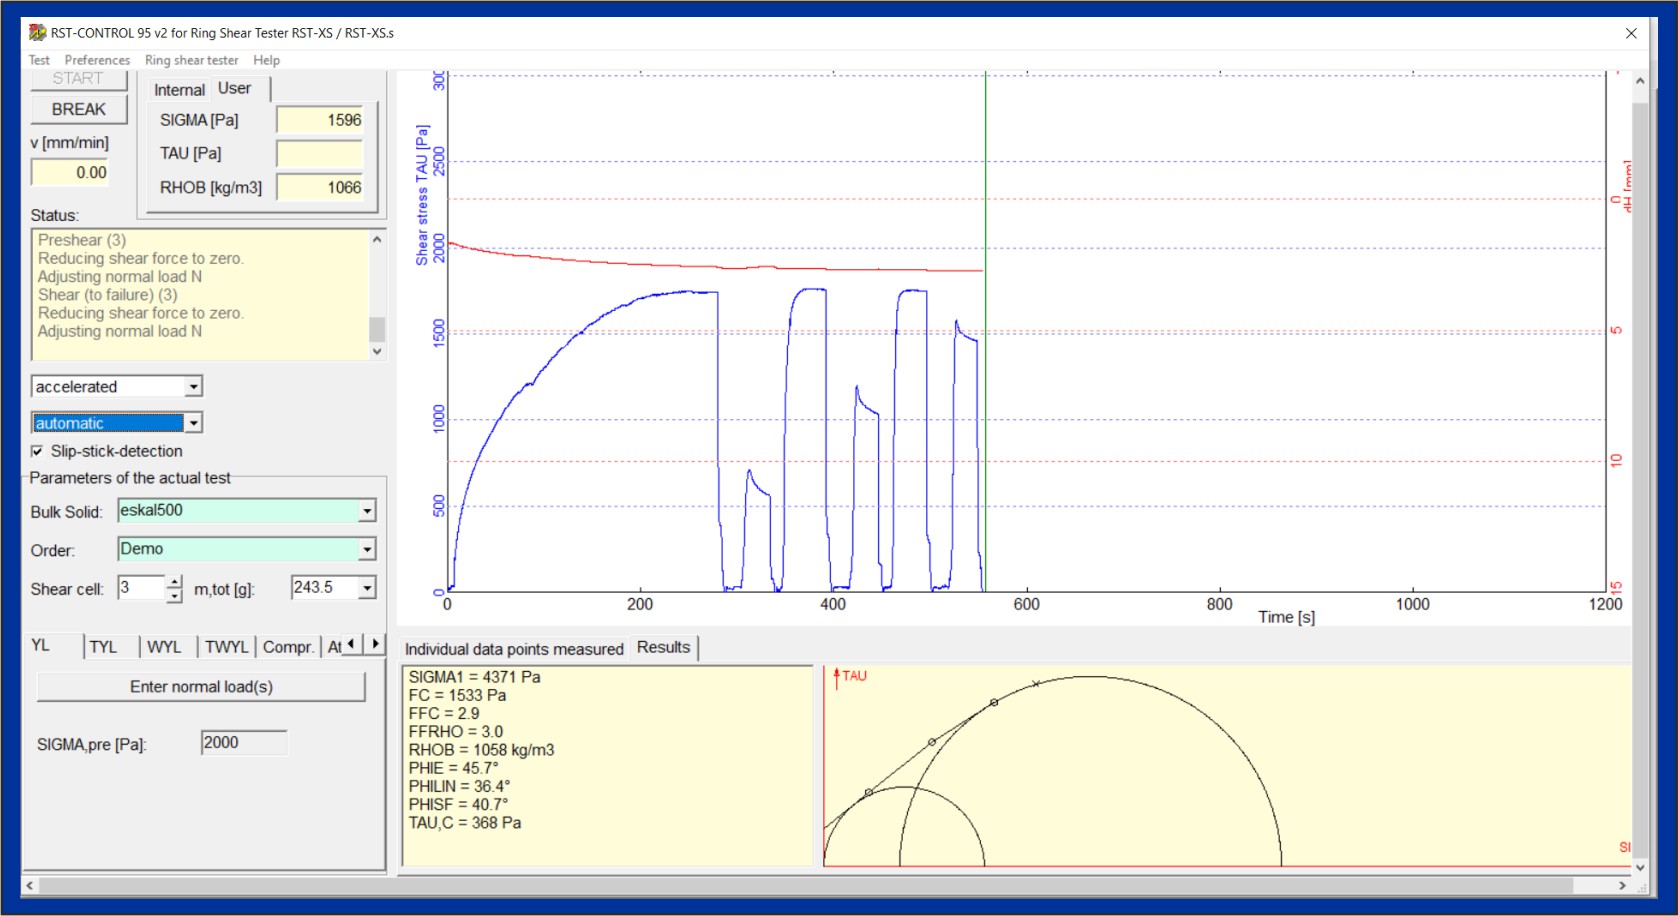
After the shear is placed on and connected to the tester, the
automatic test procedure begins. On the image below, the specimen
has already been presheared and sheared to failure three times for
the measurement of a yield locus. The blue curve shows the shear
stress over time. Due to the increase of bulk density, caused by
the consolidation process, the shear cell lid has moved downward
somewhat as shown by the descending course of the red curve "lid
displacement". In the lower part of the image, the preliminary
evaluation has been activated, where the yield locus constructed
from the points already measured is displayed with the associated
flow properties to the left (e.g., FC = unconfined yield strength,
RHOB = bulk density).
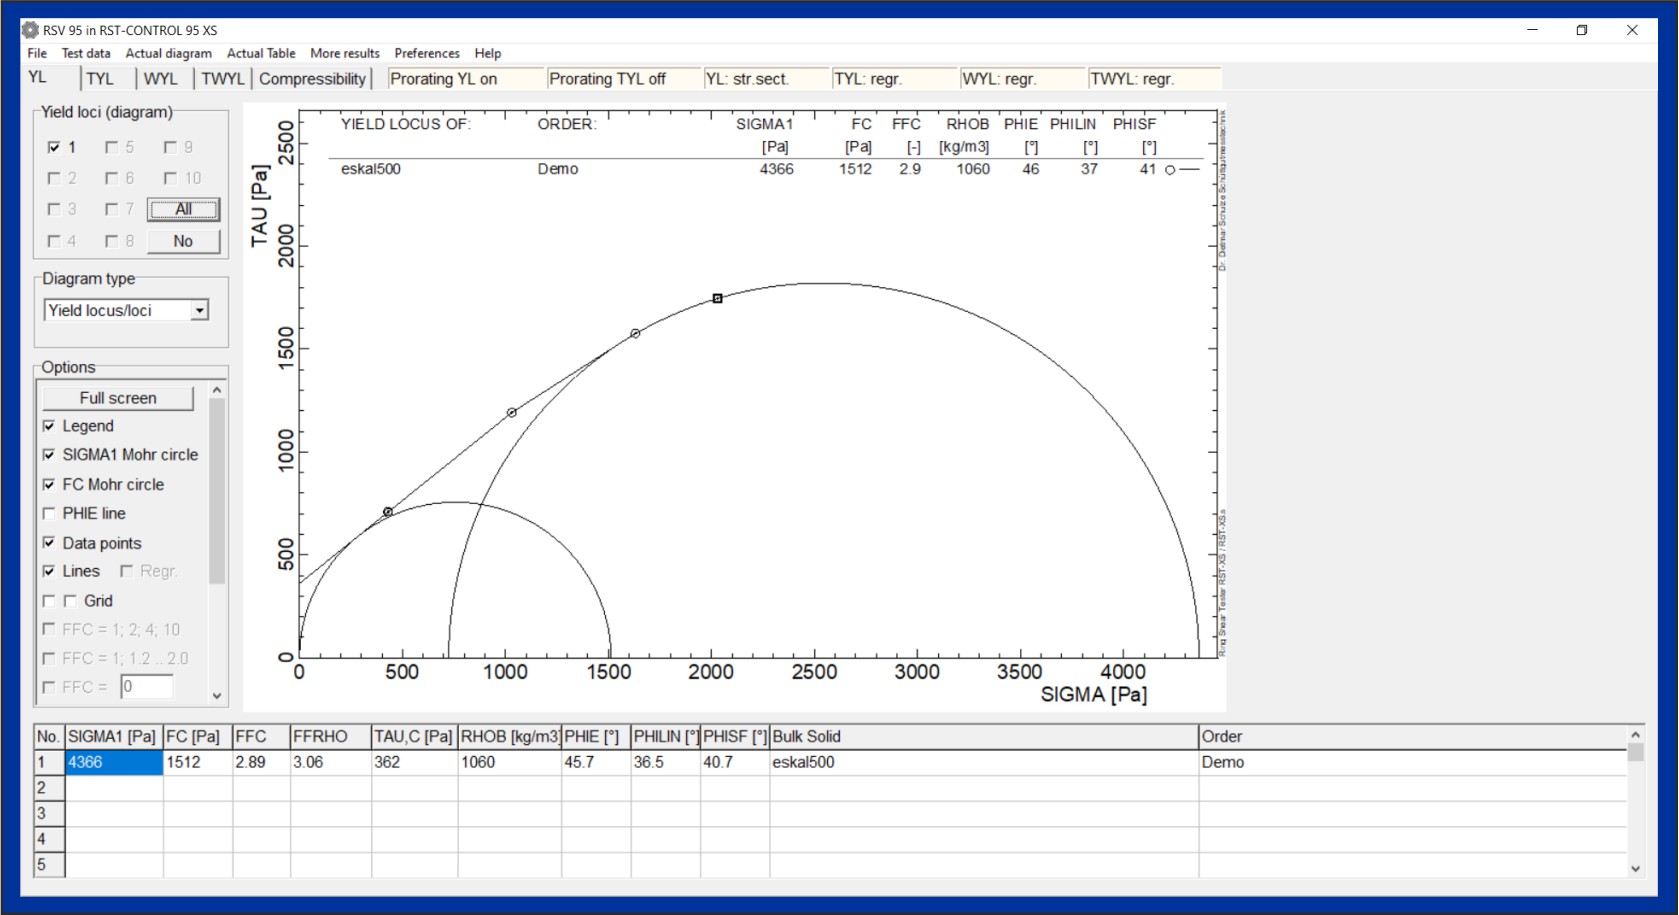
After completion of the test, the measurement data are saved. On
the evaluation window (picture below, shown is the previously
measured yield locus with the flow properties) the test results
can then be viewed in detail or evaluated differently, and printed
or exported as a graphic or table. Furthermore, other measurements
can be added to compare the test results (e.g. the flow behavior
of different samples or mixtures). Furthermore, the output files
generated by RST-CONTROL 95 can be imported by the program CAHD -
computer-aided hopper design.
System requirements
PC running Microsoft Windows® 7/8/10/11*, screen
resolution min. 1024x768, one free serial communication port or
USB port. For the acoustic user guide (optional) sound card and
speakers are required.
* Microsoft Windows® 7, Windows®
8, Windows® 10, and Windows® 11 are registered
trademarks of Microsoft Corp., U.S.A.
Technical modifications and errors excepted.
